INFOGRAPHICS
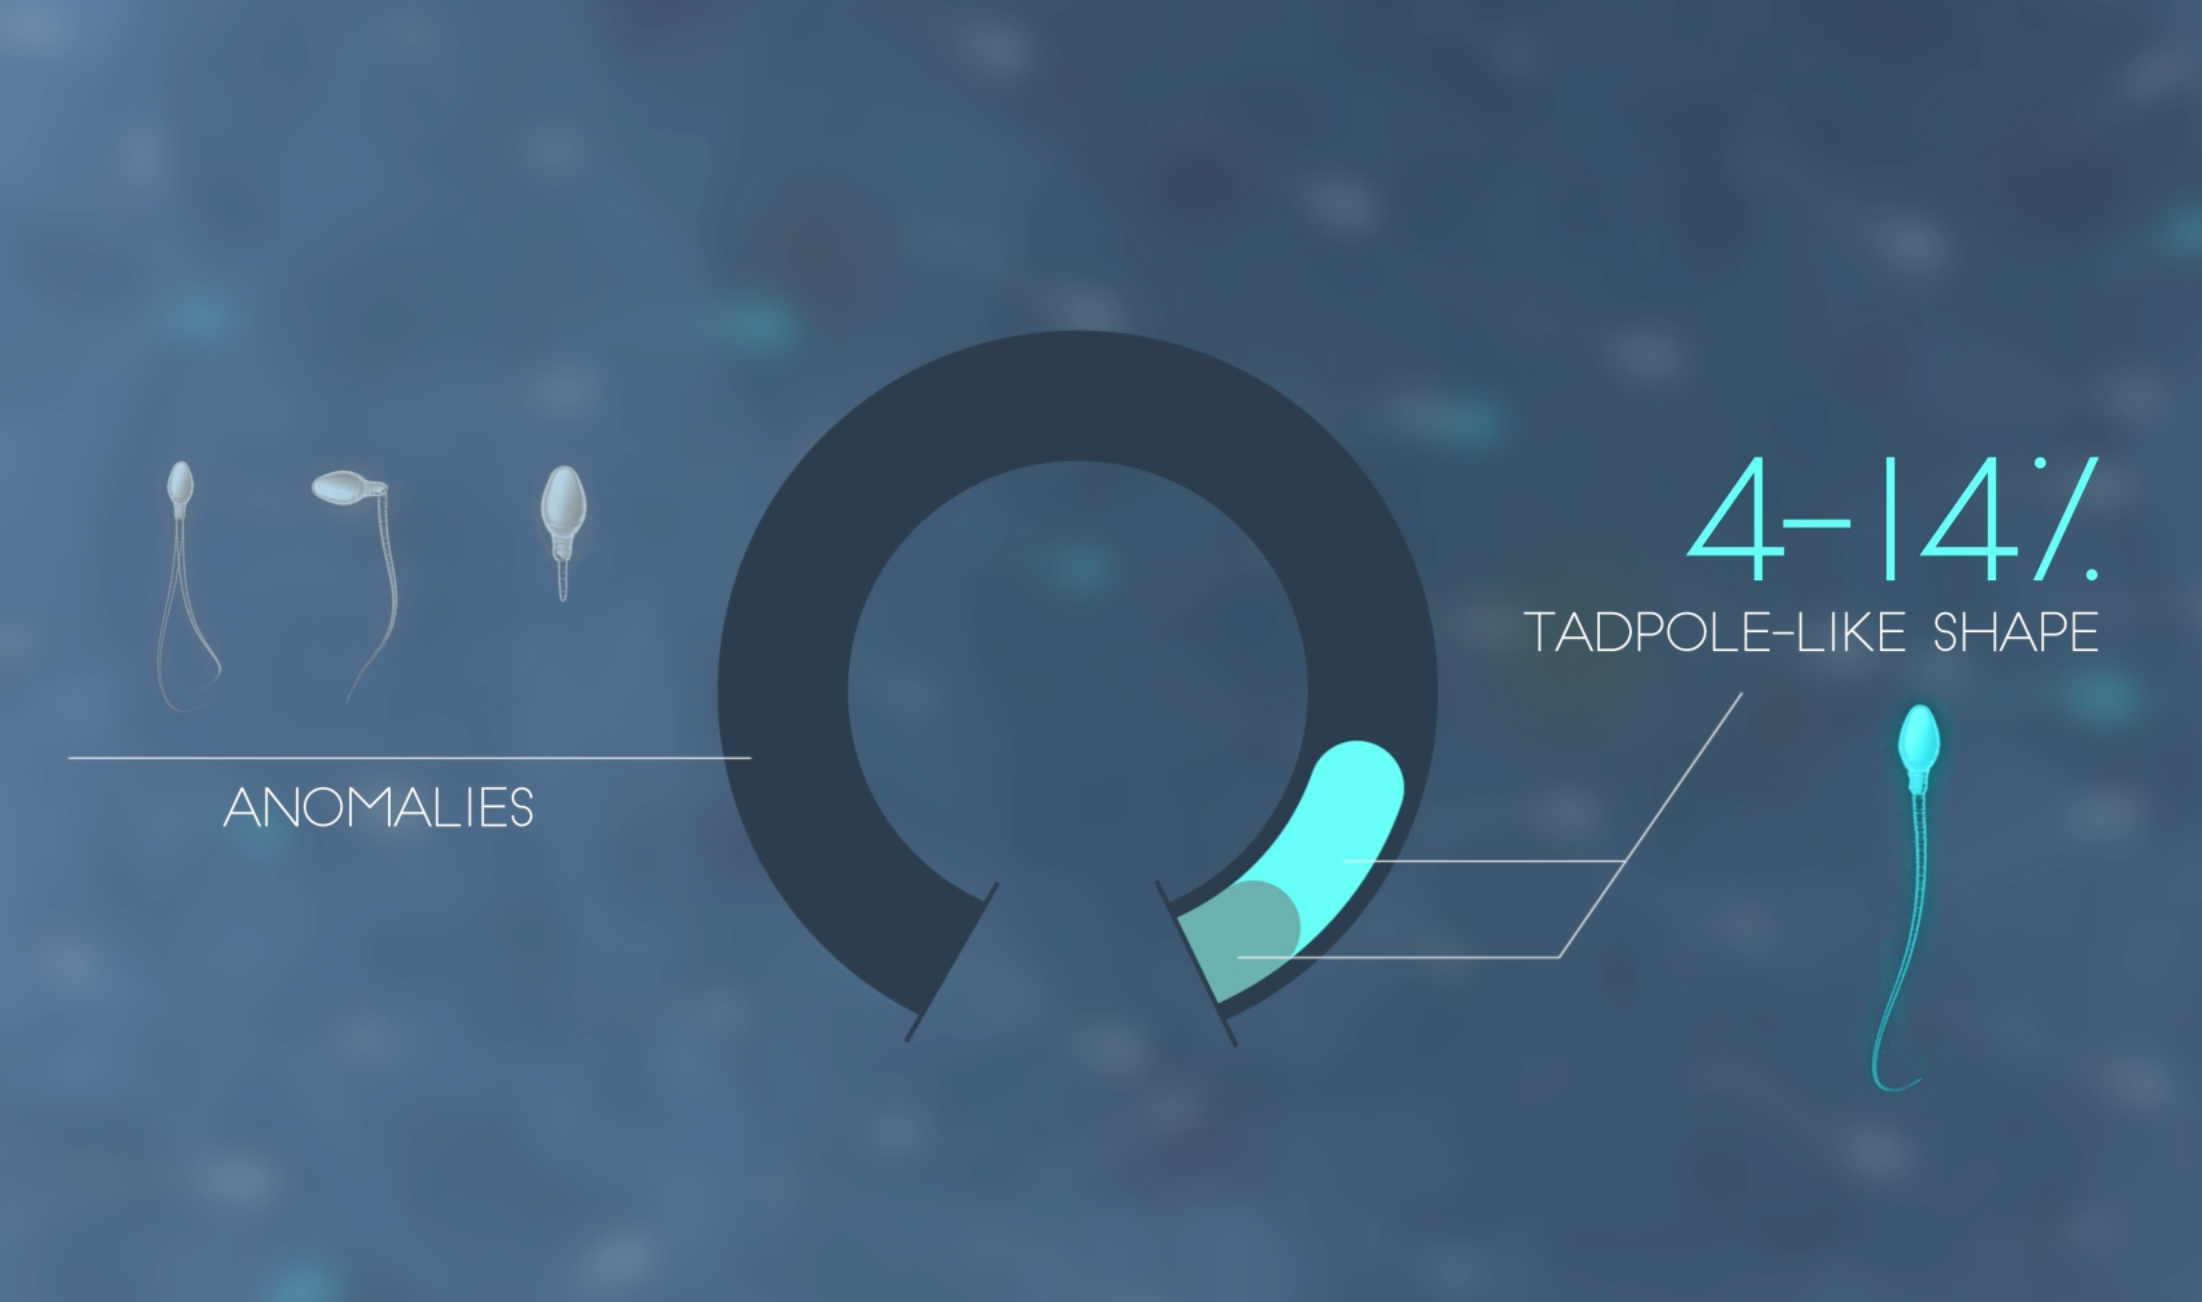
The term Infographics (contraction of the words information and graphics) stands for a graphical representation of the information to convey.
Texts, icons, illustrations and graphs well connected between each other in an organic and enjoyable composition that captures the attention and promotes the understanding of complex concepts1 .
The rationale is intuitive: compared to long and complex text, information conveyed through clear images and brief textual explanations are more quickly processed and more efficiently recalled by our brain2,3.
Given the complexity of Science and Technology topics, ad hoc designed infographics represent valuable tools for the following activities:
Making infographics at the same time aesthetically captivating and scientifically accurate requires:
- Reliable references;
- Relevant data synthesis;
- Brief text to support data;
- Logical connections toward a clear and organic narrative;
- Simple and harmonious design;
- Audience-tailored style;
- Format proper to the communication channel adopted.
Nabu Creative Studio brings together a multidisciplinary team of scientists, graphic designers and digital communicators to produce static or animated, 2D or 3D, infographics according to the specific communication goal.
Spreading knowledge through a both intellectual and aesthetic experience.
References:
- Enhancing the quality of learning through the use of infographics as visual communication tool and learning tool. In the Proceedings ICQA 2013.
- Graphic Organizers: A Review of Scientifically Based Research. The Institute for the Advancement of Research in Education (IARE) at AEL. ©2003 Inspiration Software, Inc.
- Repetition and dual coding in procedural multimedia presentations. Applied Cognitive Psychology. DOI:10.1002/acp.1396.
- Science–graphic art partnerships to increase research impact.Commun Biol. DOI: 10.1038/s42003-019-0516-1.
- The Power of Visual Communication. Showing your story to land the message. Pwc

